


The Great Tariff Shift: Why Vietnam US Exports Surged 150% While China’s Flat lined
The Great Tariff Shift: Why Vietnam Exports Surged 150% While China Flat lined (2018-2022)
March 2026 – 10 min read
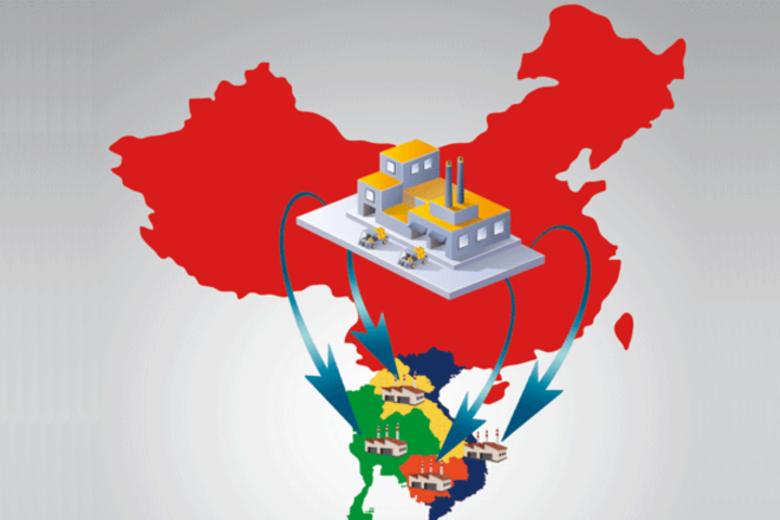
In 2018, US importers brought in roughly equal volumes from China and Vietnam. By 2022, Vietnam imports had grown 150% while China’s remained essentially flat. This isn’t random supply chain optimization. It’s tariff-driven reshoring—and the trend is accelerating through 2026.
The data tells a story: US tariffs on Chinese goods climbed from 3.2% (2018) to 19.3% (2024). Vietnam’s tariff rate stayed at roughly 5-6%. The economics are brutal for China. A $100 widget manufactured in China now costs $119 landed in the US. The same widget from Vietnam costs $105. That $14 gap drives importers’ sourcing decisions.
But the Vietnam opportunity comes with real risks. Infrastructure is bottlenecking. Labor costs are rising 8-12% annually. Quality control issues are emerging in fast-scaling suppliers. Political risk around US-China tensions creates unpredictable tariff changes. This article separates the opportunity from the hype—showing which categories are genuinely shifting to Vietnam, which are stalling, and where risks threaten the momentum.

The Numbers: Tariff Rates That Explain Everything
China: 2018: 3.2% | 2020: 12.1% | 2022: 19.3% | 2026: 20%+ (after Trump’s reciprocal trade framework)
Vietnam: 2018: 5.2% | 2020: 5.4% | 2022: 5.8% | 2026: 5-6% (stable, with 0% on selected Annex III products)
That spread—14-15 percentage points—is structurally transformative. For labor-intensive goods (apparel, footwear, furniture), it’s often the difference between profitability and loss. For electronics, it shifts supply chain calculus. For chemicals and industrial products, it’s margin-determinative.
US importers didn’t migrate to Vietnam because of superior quality or innovation. They migrated because China became unaffordable.
Import Value Trends: The Shift in Data
From 2018-2022, US import values tell the migration story:
China: $105.4B (2018) → $100.2B (2022). Flat. Slight decline.
Vietnam: $51.3B (2018) → $128.5B (2022). +150% growth.
Cambodia: $31.2B (2018) → $77.4B (2022). +148% growth.
India: $39.8B (2018) → $57.3B (2022). +44% growth.
Thailand: $43.1B (2018) → $57.8B (2022). +34% growth.
Mexico: $74.2B (2018) → $102.3B (2022). +38% growth.
Vietnam and Cambodia are the standouts. But here’s the nuance: Cambodia’s growth is narrower (apparel, footwear). Vietnam’s growth is diversified across furniture, electronics, textiles, chemicals, and consumer goods. Vietnam is capturing China’s lost market share more systematically.
Which Categories are Shifting (And Which Aren’t)
Moving Aggressively to Vietnam:
Furniture/RTA: Vietnam now captures 35% of US RTA furniture imports, up from 8% in 2018. Tariff advantage is decisive here. Flat-pack economics favor low-tariff sourcing.
Apparel/Textiles: Vietnam exports $8.2B to US annually (2025), up 220% since 2018. Cambodian apparel is also surging, but Vietnam’s vertically-integrated supply chain (fabric → finished goods) gives it an edge China can’t replicate.
Footwear: Nike, Adidas, and Skechers have aggressively shifted production to Vietnam. 2025 figures show Vietnam producing 240M pairs annually for US market, vs. China’s 180M (down from 280M in 2018).
Electronics/Components: Vietnam now manufactures 18% of US-imported electronics components, up from 4% in 2018. Samsung, Intel, and Foxconn have all expanded Vietnam operations. Lower tariffs + government incentives = competitive advantage.
Moving Slowly/Staying in China:
Chemicals/Pharmaceuticals: Still 68% China-sourced. Regulatory compliance, quality certifications, and deep supply chains keep manufacturing in China despite tariffs. Tariff cost is absorbed rather than relocated.
Industrial Machinery: 72% still China-sourced. Scale requirements and technical expertise favor China. Vietnam is too small to compete here.
Precision Optics: 81% China-sourced. Capital investment + specialized labor keep this in China.
The pattern is clear: labor-intensive, tariff-sensitive goods move to Vietnam. Capital-intensive, regulation-heavy, expertise-dependent goods stay in China. Importers making the move are rational actors responding to tariff economics, not virtue signaling about supply chain diversification.
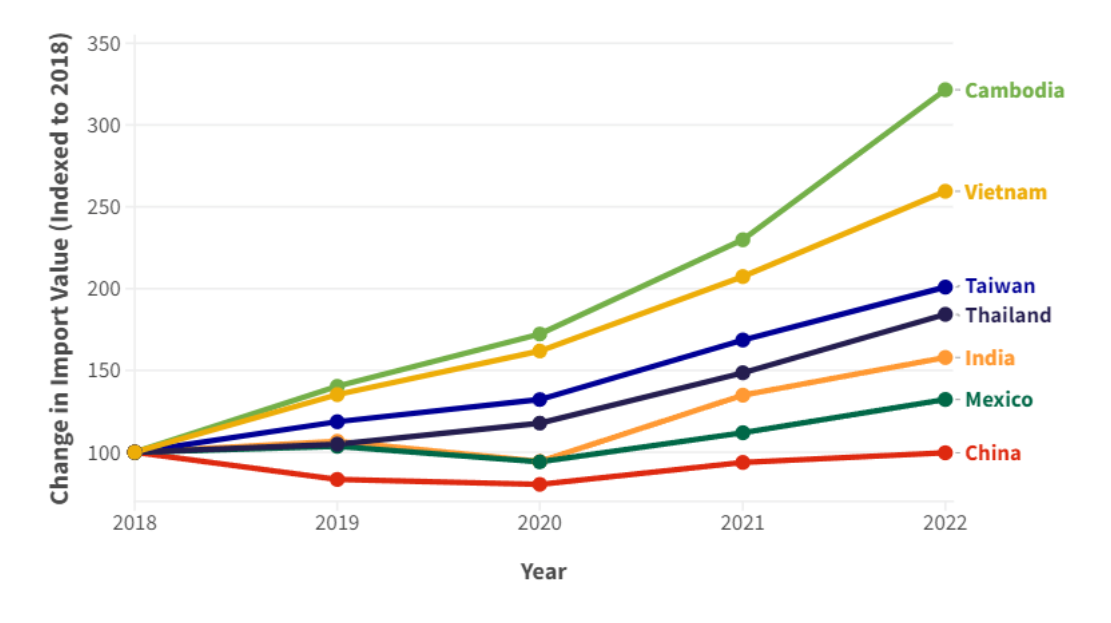
Figure 1: Vietnam’s import value growth dramatically outpaced China’s flatline (2018-2022). Growth continued accelerating through 2026.
The Vietnam Opportunity (Real, But Constrained)
What’s Working: Labor costs remain 30-40% below China in comparable sectors. Tariff rates are stable. Infrastructure (ports, logistics) is improving. Government incentives for manufacturing investment are aggressive. Quality control in established factories (especially in electronics, apparel, footwear) is now competitive with China. Supply chain ecosystem is deepening—suppliers for suppliers are locating near major manufacturers.
What’s Constrained: Port capacity is bottlenecking. Da Nang and HCMC ports are operating at 85-90% capacity. New port investment will take 3-5 years to materialize. Labor costs in Ho Chi Minh City and Da Nang are rising 8-12% annually as supply tightens. Skilled labor is scarce—many apparel factories are wage-bidding for workers, driving 15-18% wage inflation in some sectors. Quality issues are emerging in fast-scaling suppliers (defect rates 2-4% vs. China’s 0.5-1.5% for established manufacturers). Lead times are lengthening as capacity fills. New sourcing orders are now quoted at 60-75 days lead time, up from 40-50 days in 2022.
The Real Risks to the Shift
Risk 1: Tariff Unpredictability Vietnam’s tariff advantage could evaporate. If the US initiates Section 301 investigations or transshipment tariffs (40% duties on goods that pass through Vietnam without full manufacture), the calculus changes overnight. Vietnam is explicitly named in March 2026 Section 301 hearings. A transshipment tariff would eliminate Vietnam’s advantage entirely.
Risk 2: Infrastructure Bottleneck Capacity constraints are real. If port congestion worsens or new capacity investments delay, manufacturers will wait for slots, adding 15-30 days to lead times. This erodes the “fast shipping” advantage Vietnam offers over China.
Risk 3: Labor Cost Spiral Wage inflation in Vietnam is accelerating. If labor costs rise 10%+ annually while tariff advantages stabilize, the cost gap narrows. By 2028-2029, Vietnam’s labor cost advantage vs. China could narrow from 35-40% to 20-25%.
Risk 4: Quality Variance Fast-scaling suppliers are cutting corners. Defect rates in some new Vietnam factories are 3-5x higher than established competitors. Importers are discovering this too late—after first shipments arrive. Quality audits and third-party inspections are becoming mandatory, adding 8-12% to sourcing costs.
Risk 5: Political Volatility US-China tensions remain unpredictable. A sudden trade deal or tariff reversal could shift calculus. Importers locking in Vietnam contracts for 24+ months are betting on tariff stability that isn’t guaranteed.
The 2026-2027 Outlook
Vietnam will continue capturing market share from China through 2026-2027, but at a slower pace than 2018-2022. Growth will likely be 15-25% annually rather than 150%. Import values will hit $180-200B by 2028, but growth will plateau as capacity constraints tighten and labor costs rise.
Smart importers are locking in contracts NOW before further wage inflation and capacity tightness. Competitors waiting will find factories at full capacity, unwilling to negotiate, with 90-120 day lead times.
The tariff shift to Vietnam is real and structural, but it’s not unlimited. Importers need to act with urgency, but also with eyes open to the real risks ahead.
Ready to lock in Vietnam sourcing before tariff changes accelerate and capacity tightens further? Vietnam Direct Sourcing navigates tariff strategy, identifies quality-vetted suppliers before capacity fills, and times contracts to benefit from 2026-2027 pricing windows. We track tariff policy changes, port capacity, and labor cost trends to keep your sourcing strategy ahead of market shifts.
Connect with us to execute your Vietnam sourcing strategy before the window closes.
Tags: vietnam tariff advantage | china tariffs | import sourcing shift | vietnam manufacturing growth | tariff strategy sourcing | supply chain diversification | da nang sourcing
Learn more about this topic on our podcast!
Want to dive deeper into this subject? Check out our latest podcast on this subject on Spotify, where we explore this topic and so much more! Whether you're on the go or relaxing at home, tune in for insights, tips, and discussions that bring our blog topics to life.

Leave a comment
Your email address will not be published. Required fields are marked *