


Vietnam’s Energy Resilience Strategy: How Manufacturing Survives Global Energy Shocks in 2026
Vietnam’s Energy Resilience Strategy: How Manufacturing Survives Global Energy Shocks in 2026
Febuary 2026 – 14 min read
Vietnam imported 14.15 million tons of crude oil in 2025. It produces almost none domestically. When Middle East conflicts spike global oil prices, Vietnam’s manufacturing sector absorbs the shock first and hardest. Yet by late 2026, something fundamental will have changed. Vietnam’s energy diversification strategy—implemented with urgency and capital—will begin to insulate the country from exactly these kinds of shocks.
This matters for importers because energy costs are manufacturing costs. When Vietnam’s grid stabilizes through diversification, your sourcing costs normalize. When competing countries struggle with energy constraints, Vietnam gains competitive advantage. Understanding Vietnam’s energy resilience strategy is understanding why Vietnamese manufacturing will outcompete alternatives through 2026 and beyond.
This article breaks down Vietnam’s energy infrastructure, examines each key source (hydroelectric, solar, wind, coal, oil), compares Vietnam’s position to regional competitors, and explains the timeline for cost stabilization that directly impacts your sourcing strategy.
The Energy Crisis That Became a Strategy
Vietnam’s energy vulnerability is structural. The country has no significant oil reserves. Domestic crude production peaked at 370,000 barrels per day in 2004 and has declined 85% since, now at just 55,000 bpd. To power a manufacturing sector growing 12-15% annually, Vietnam imports roughly 90% of its oil. When Middle East tensions disrupted global supplies in late 2025, Vietnamese factories immediately faced 30-50% increases in energy costs.
But vulnerability catalyzed strategy. In March 2026, the Vietnamese government declared energy security a national priority and allocated $136.3 billion for renewable energy and grid modernization through 2030. This isn’t incremental investment. It’s structural transformation.
The timeline matters: Q2-Q3 2026 will see peak energy costs as Vietnam transitions. Q4 2026 and 2027 will see dramatic cost normalization as 6-8 GW of new renewable capacity comes online. Importers locking in manufacturing contracts NOW at peak-cost pricing will benefit when renewable capacity stabilizes costs. Competitors waiting will find factories fully booked and unwilling to discount.
Vietnam’s Energy Mix: Where Power Comes From (And Where It’s Going)
Current Mix (2025):
Coal dominates at 38% of Vietnam’s electricity generation. Hydroelectric accounts for 28%. Oil/gas combined provide 21%. Solar contributes just 2%. Wind contributes 1%. Renewables total roughly 31% of generation capacity.
This mix is the problem. Coal is cheap but creates grid stress during peak demand. Hydroelectric is reliable but has minimal growth capacity (most viable sites are already developed). Oil/gas is expensive when global prices spike and vulnerable to supply disruptions.
Hydroelectric: The Foundation (But Limited Growth)
Vietnam’s hydroelectric capacity stands at 16.8 GW, providing 28% of annual electricity generation. The system includes major dams across the Mekong and Red River basins. Hydroelectric is reliable, dispatchable (dam operators can adjust output), and low-cost to operate once infrastructure is built.
But growth is capped. Vietnam has already developed 80% of its viable hydroelectric sites. Remaining projects face environmental and resettlement challenges. Hydroelectric generation also varies seasonally—heavy rainfall in monsoon season (May-October) creates generation surplus, while dry season (November-April) creates deficit. This seasonal volatility forces Vietnam to rely on coal plants to fill dry-season gaps.
New hydroelectric capacity through 2030 will add just 1-1.5 GW, representing 6-8% growth. Hydroelectric’s strategic role will remain as baseload + storage for seasonal flexibility, not as the driver of expansion.

Figure 1: Vietnam’s hydroelectric system provides reliable baseload power but growth is capped at existing viable sites.
Solar: The Growth Engine
Solar is where Vietnam’s energy transformation accelerates. Current capacity: 16.5 GW. Planned additions through 2030: 30-35 GW. This represents a 200% expansion of Vietnam’s solar infrastructure in just four years.
Why solar? Economics and geography. Vietnam’s central provinces receive 4.5-5 kWh/m²/day of solar radiation—excellent for solar conversion. Manufacturing costs for solar panels have dropped 90% since 2010. Installation costs continue falling. Solar farms can be deployed in 12-18 months, compared to 5-7 years for coal or hydroelectric plants.
Vietnam’s solar strategy focuses on distributed generation: utility-scale farms in southern and central provinces, plus rooftop solar on industrial facilities. By end of 2026, Vietnam will have installed 22-24 GW of solar capacity—a 35% increase from current levels. By 2030, solar will represent 15-18% of Vietnam’s total electricity generation, up from 2% today.
Manufacturing impact: Solar-powered factories can reduce grid electricity costs by 25-35% through self-generation and storage. Many Vietnamese manufacturers—particularly in textiles, electronics, and food processing—are already installing rooftop solar to hedge against grid costs.
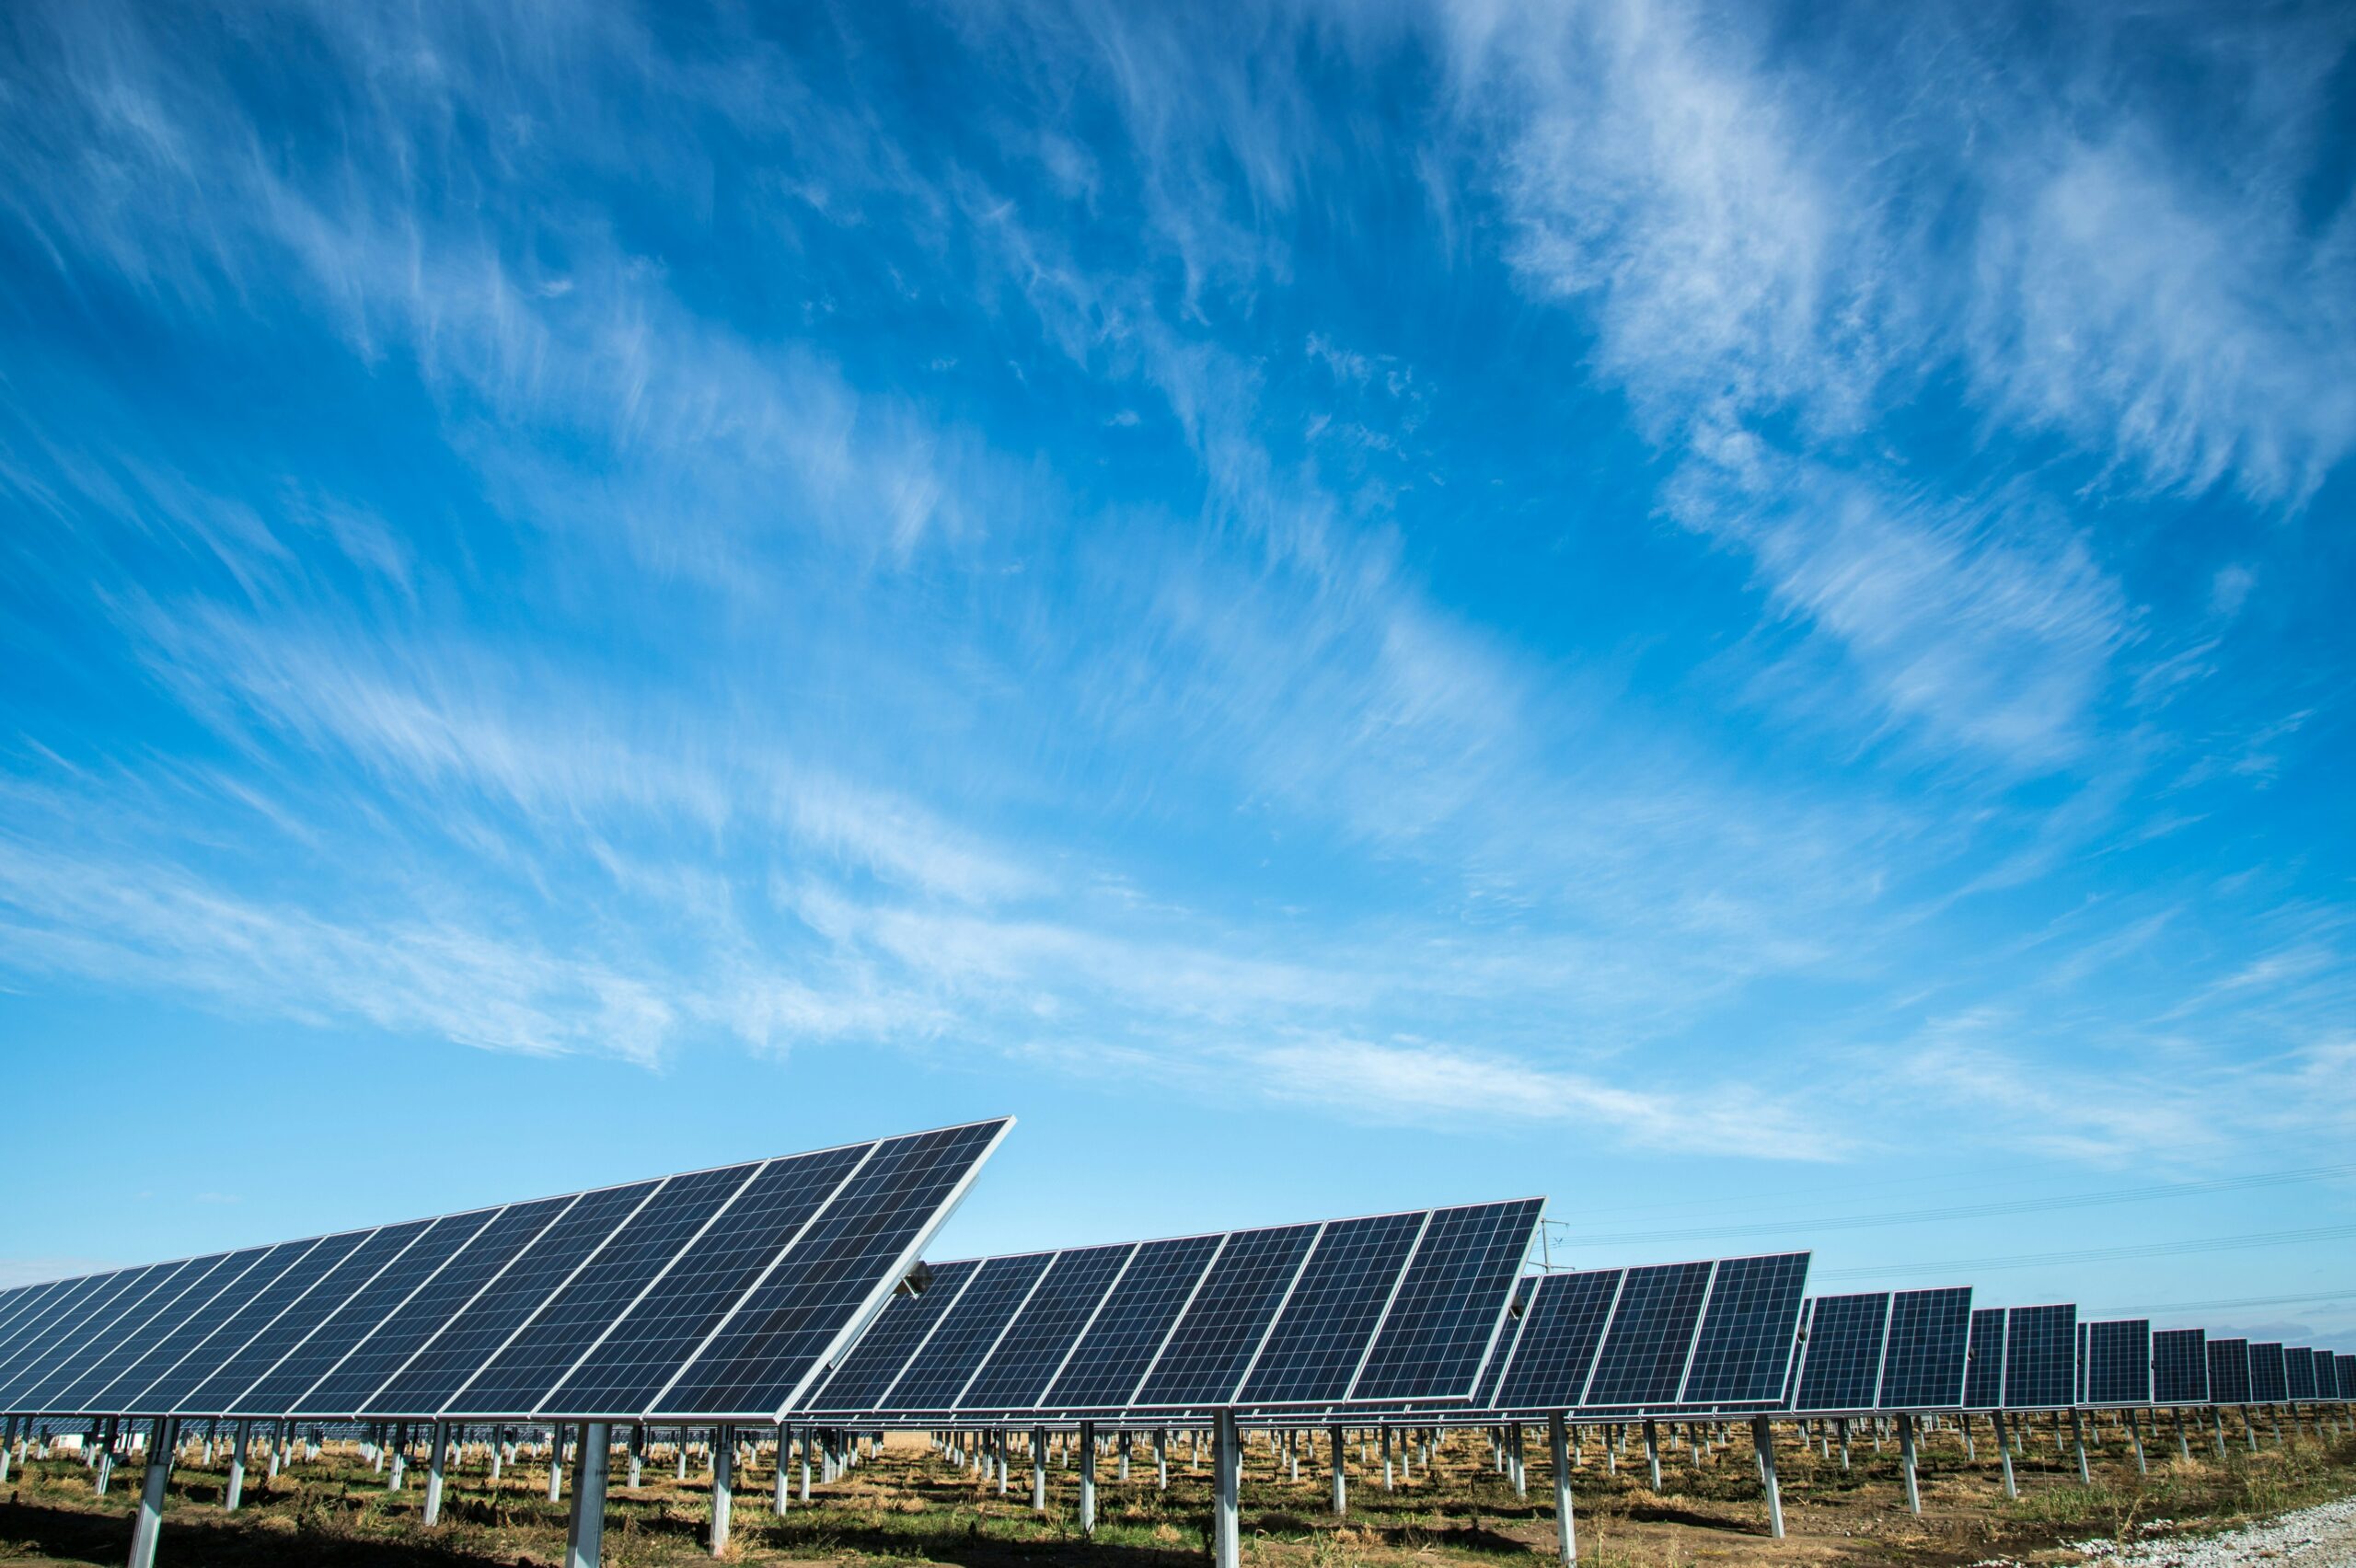
Figure 2: Solar capacity will triple by 2030, becoming Vietnam’s second-largest generation source. Factory rooftop solar is accelerating deployment.
Wind: The Offshore Revolution
Vietnam’s wind potential is exceptional—coastal geography and northeast monsoon winds create ideal conditions. Current capacity: 7.5 GW (primarily onshore). Planned additions: 16-18 GW onshore + 5-7 GW offshore through 2030.
The Monsoon Wind Power Project (600 MW, went live August 2025) is Vietnam’s largest onshore wind farm. The Nam Po Wind Farm (300 MW, operational by December 2026) will follow. But the real game-changer is offshore wind, where Vietnam is investing heavily.
Offshore wind advantages: Higher and more consistent wind speeds (8-9 m/s) vs. onshore (5-6 m/s); minimal land use conflict; capacity factors (35-45%) compared to onshore (25-30%). Vietnam aims to deploy 5-7 GW of offshore wind by 2030, with installations concentrated in the Mekong Delta and southern coastal regions.
Timeline: First major offshore installations will come online Q3-Q4 2026. By 2027, offshore wind will contribute 2-3% of Vietnam’s total generation. By 2030, wind (onshore + offshore combined) will represent 12-15% of generation, up from current 1%.
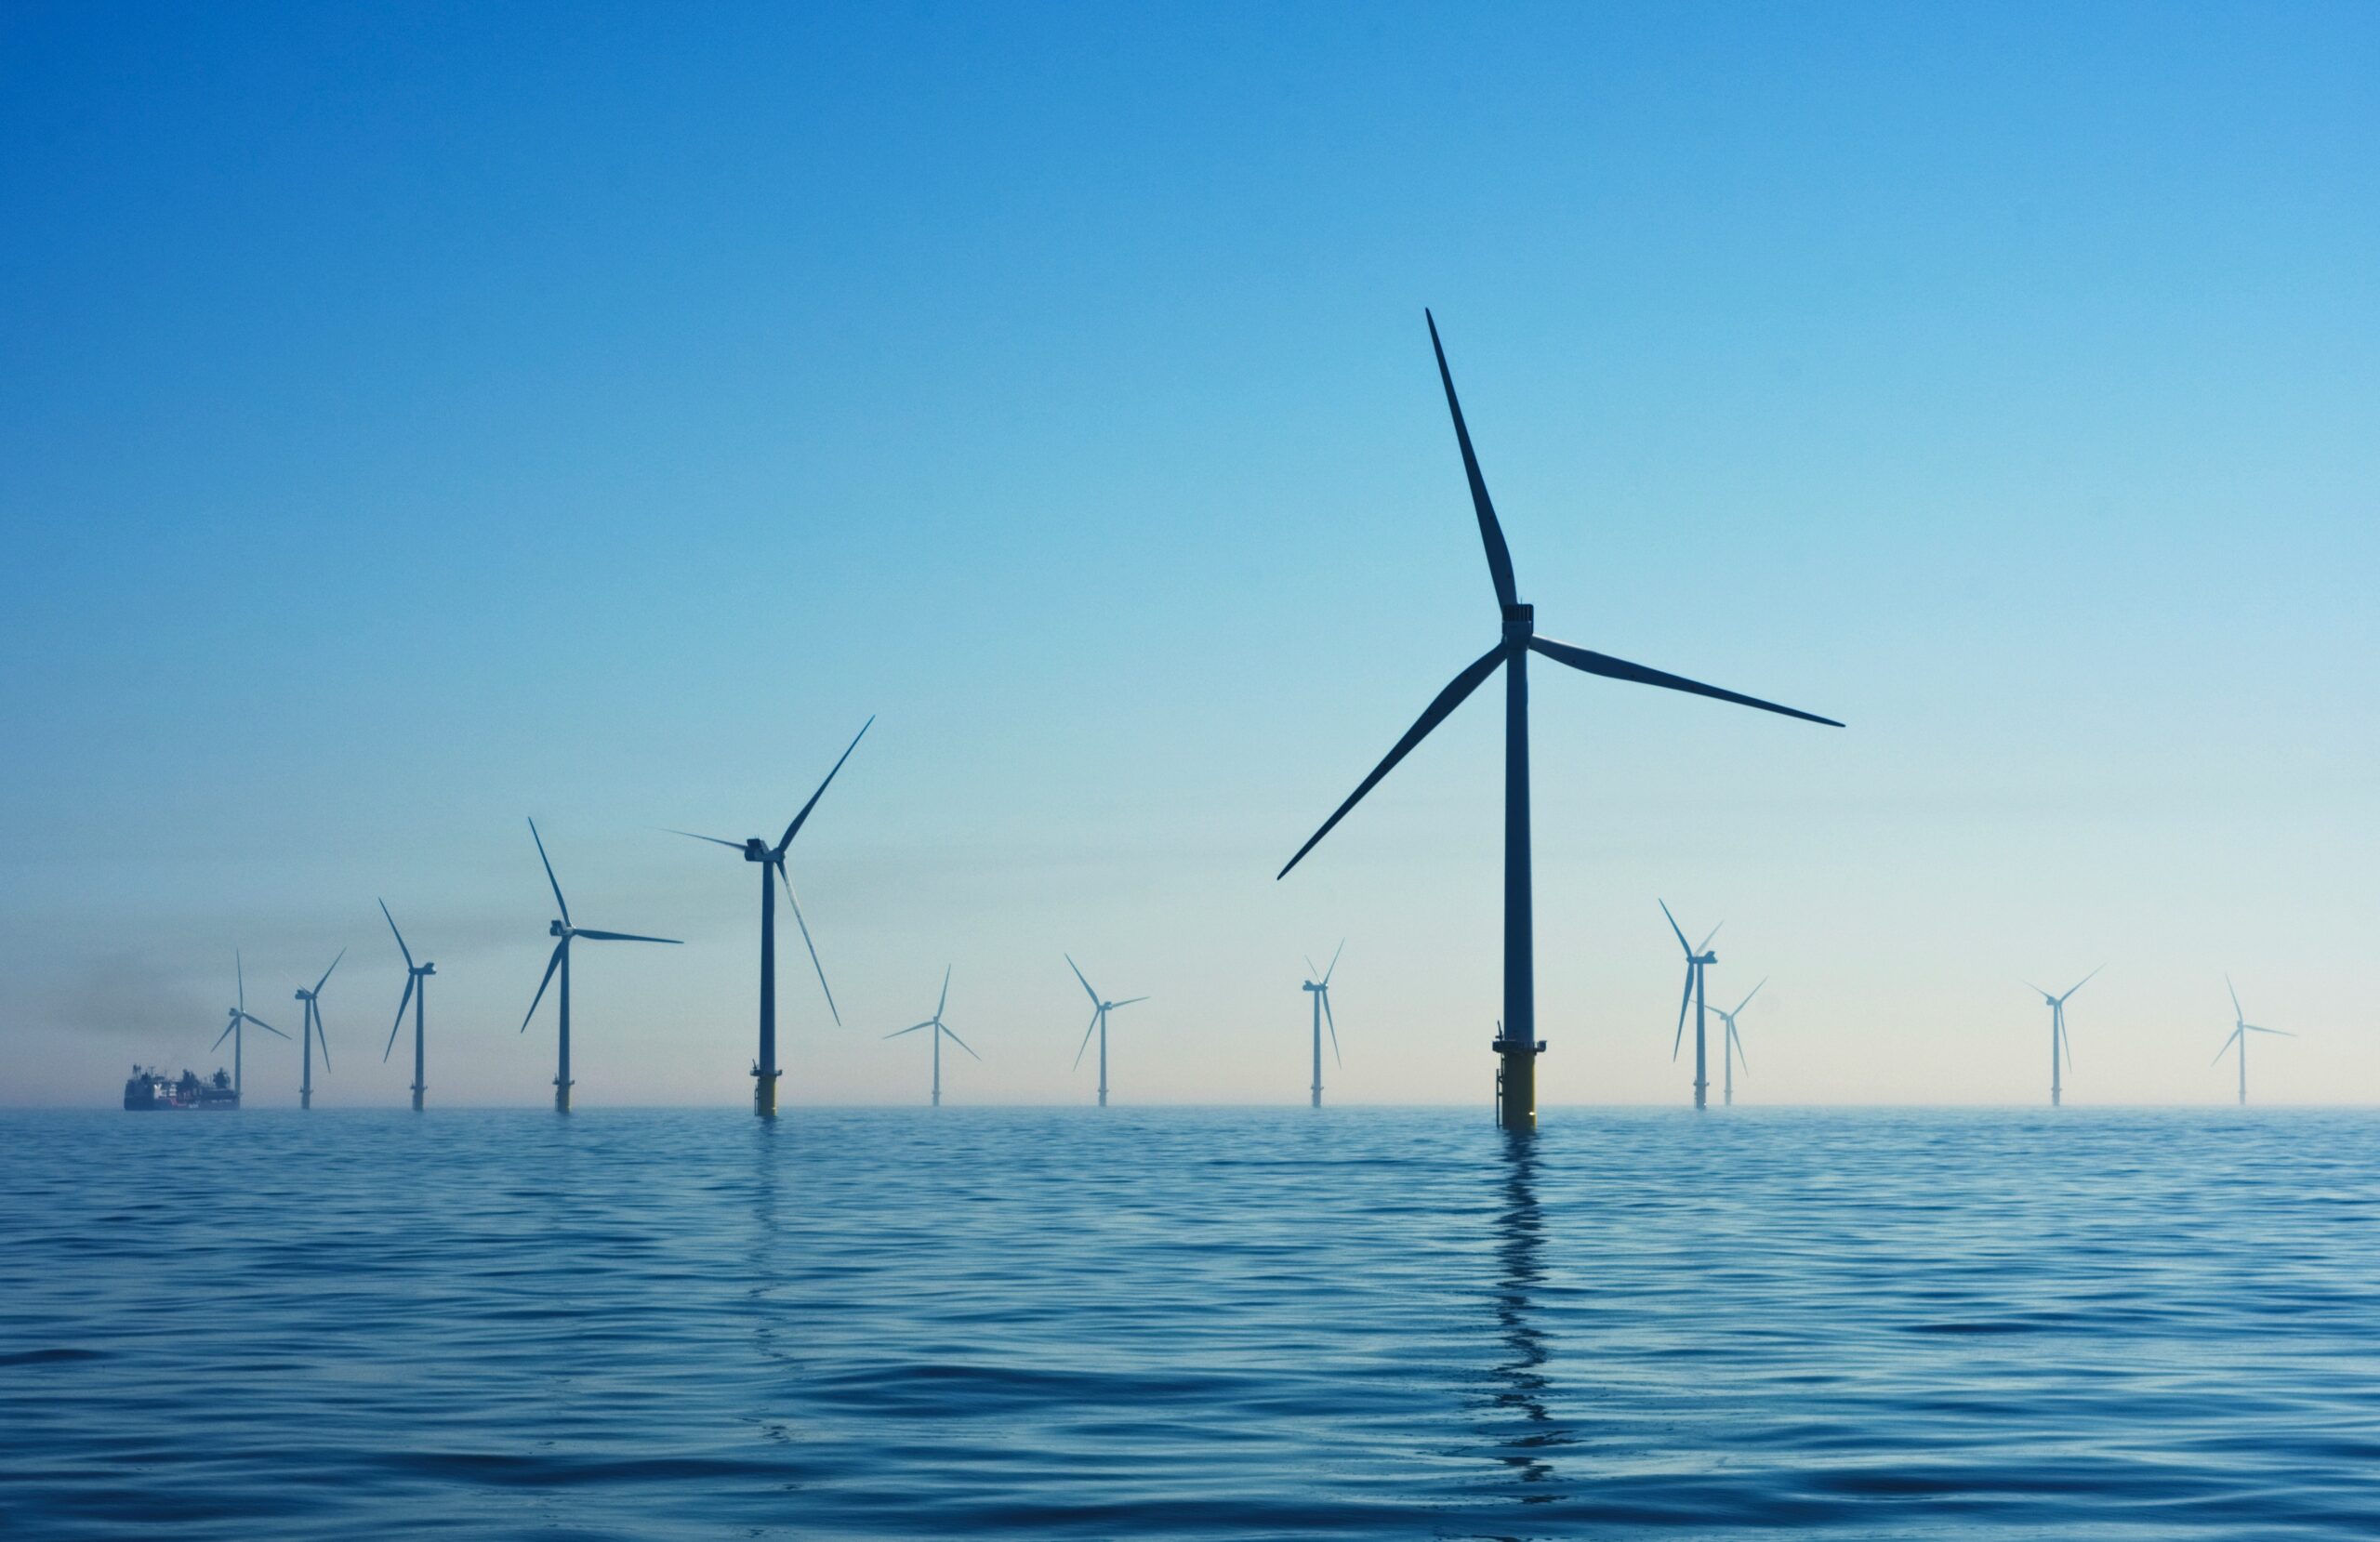
Figure 3: Offshore wind capacity will add 5-7 GW by 2030, providing consistent renewable baseload power during monsoon transitions.
Coal: The Shrinking Baseload
Coal currently provides 38% of Vietnam’s electricity and is unlikely to be eliminated entirely. Coal plants provide dispatchable baseload power that’s essential when renewables (solar/wind) fluctuate. But coal’s role is changing from primary source to backup.
Vietnam’s coal reserves stand at 3.1 billion tons. At current consumption rates (45-50 million tons annually), this represents 60+ years of supply. But Vietnam is deliberately reducing coal dependence: mining output declined 15% from 2020-2025 as the government prioritized renewables.
By 2030, coal’s share of Vietnam’s electricity generation will decline to 25-28% as renewable capacity expands. New coal plant construction has essentially stopped—no new coal plants are planned after 2027. Existing coal plants will operate as backup/peaking plants rather than baseload.
This shift has two sourcing implications: First, coal costs will remain stable (abundant domestic supply) but won’t drive grid prices down—coal plants will operate less frequently. Second, factories dependent on cheap coal-powered grid electricity must diversify to solar/wind self-generation or face higher blended electricity costs.
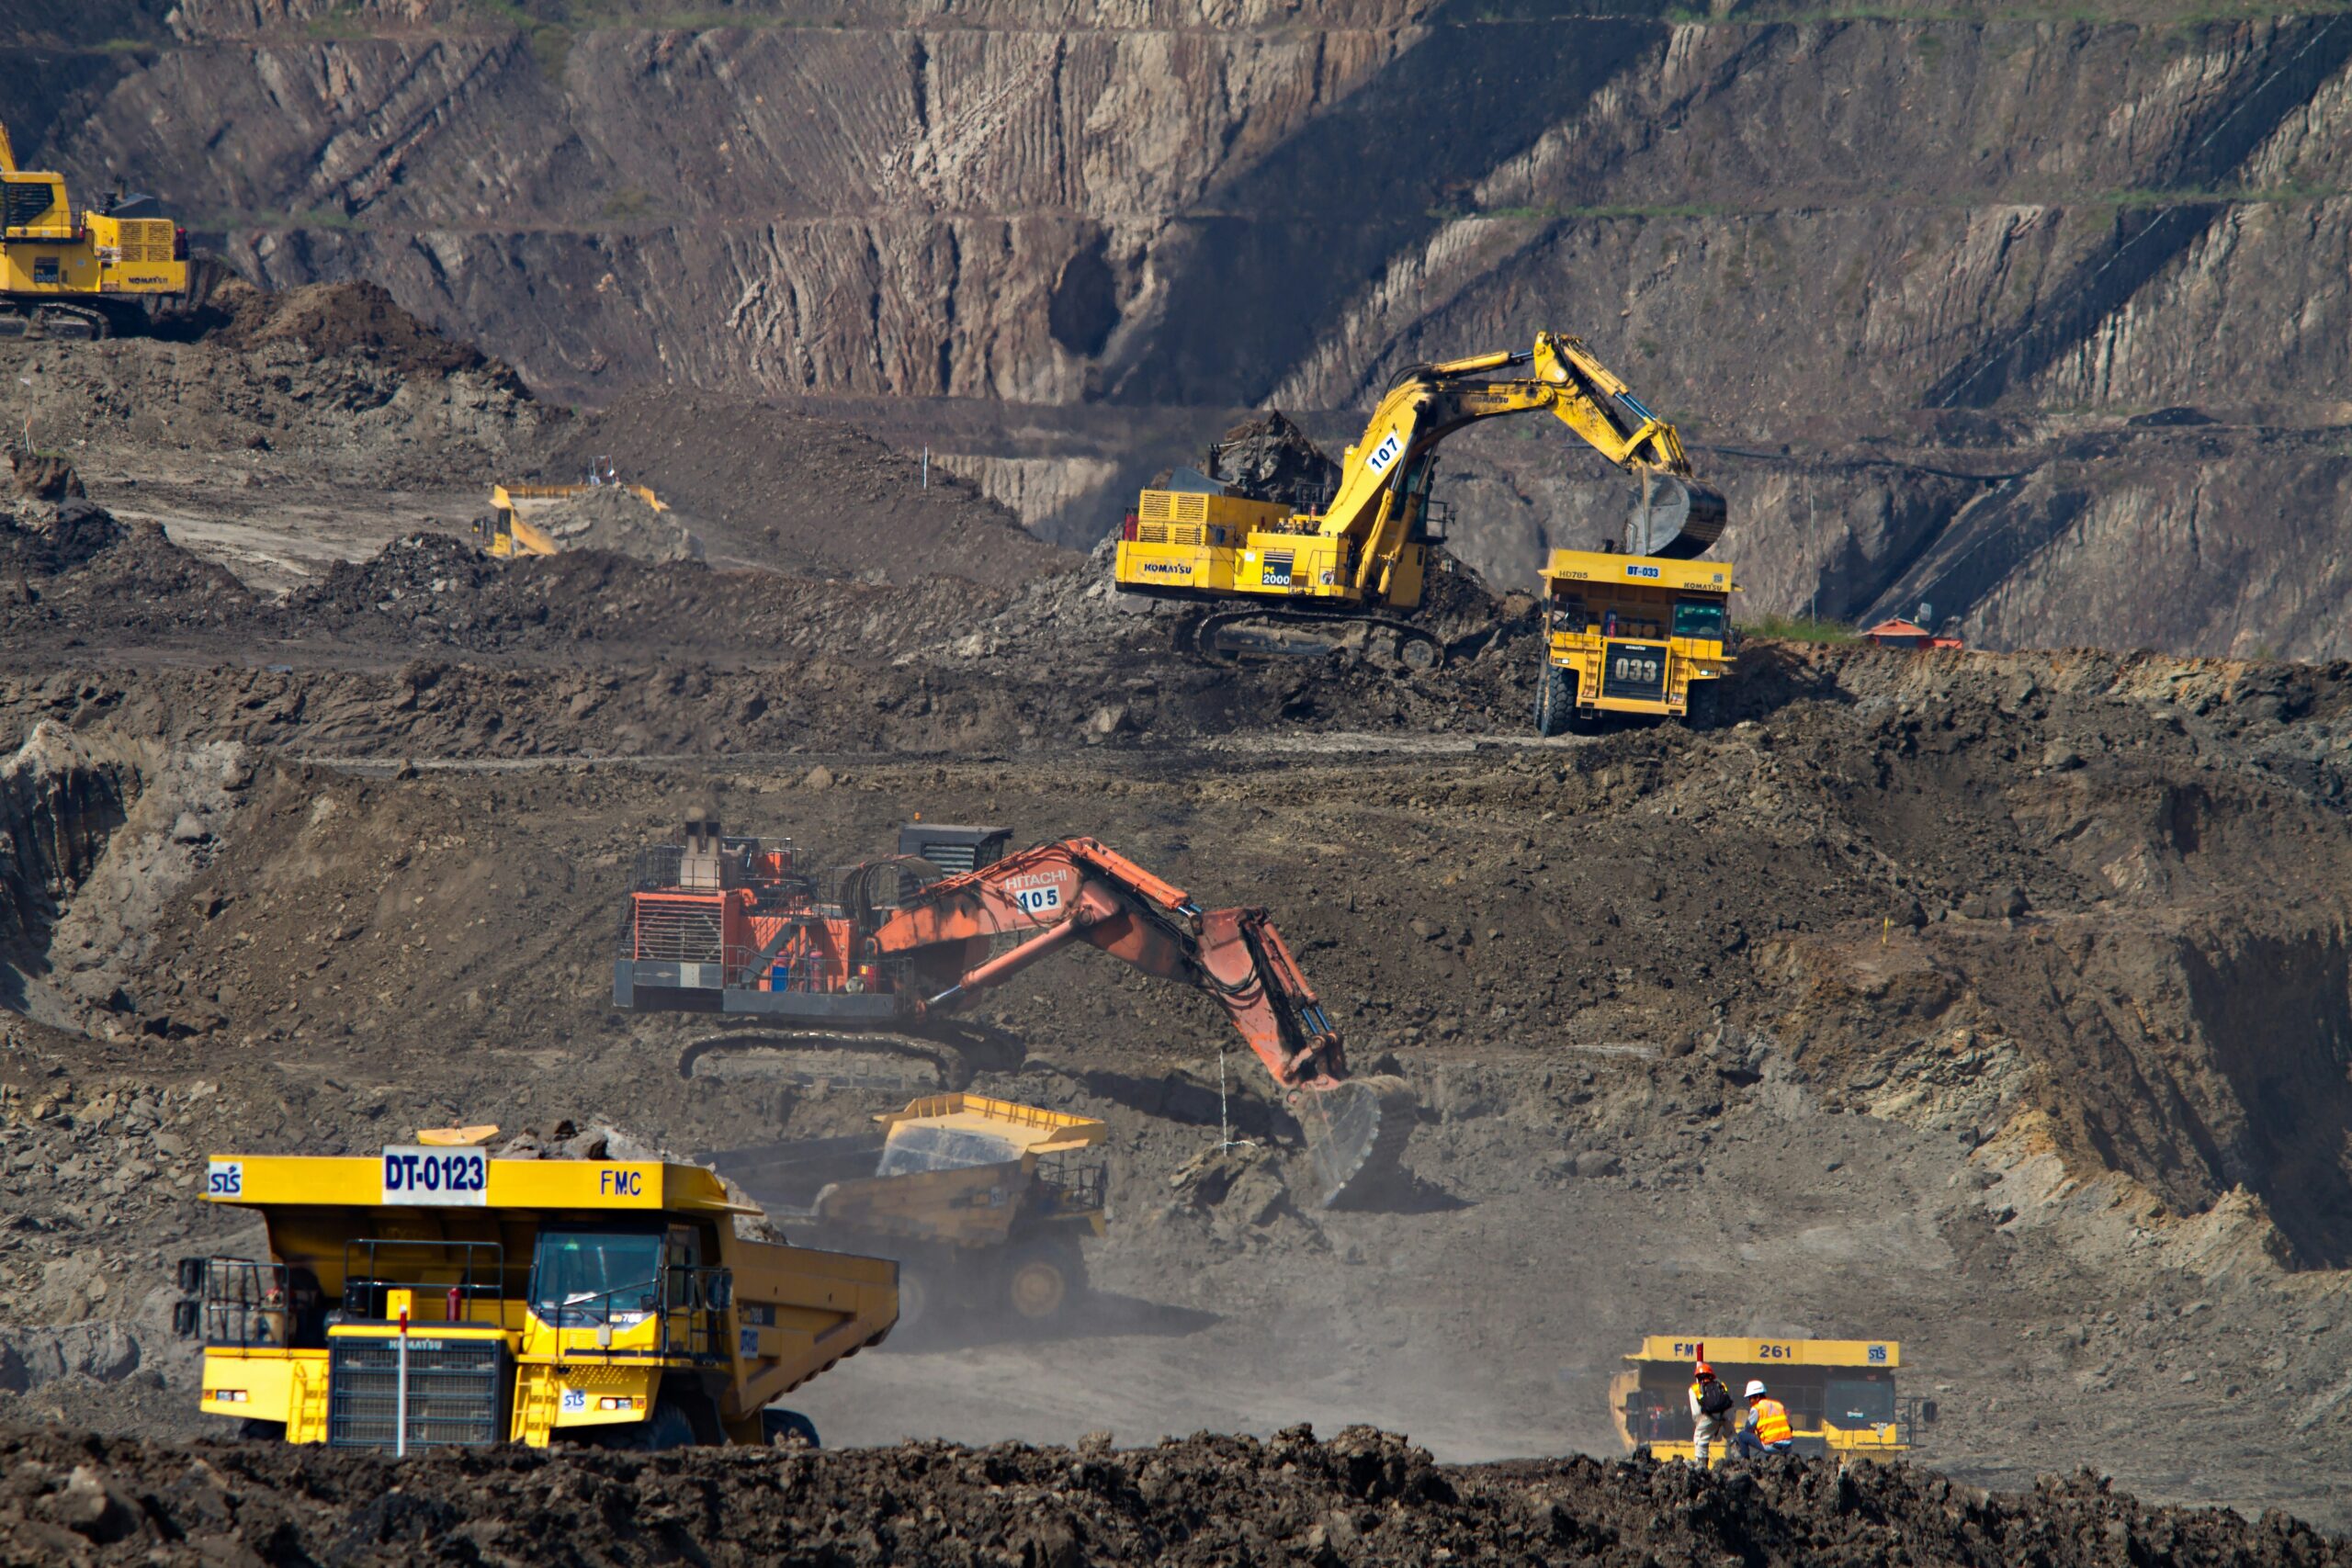
Figure 4: Coal’s role is shifting from baseload to backup as renewables expand. Coal mining output will decline 8-10% annually through 2030.
Oil and Gas: Import Dependence Will Persist
Vietnam’s oil/gas sector produces 55,000 bpd (crude) and 8-10 billion cubic meters annually (natural gas). Domestic production covers only 10% of oil demand and 25% of natural gas demand. Import dependence is structural and will persist through 2030.
The government’s response: negotiate long-term supply agreements with Qatar, UAE, Angola, and Russia to reduce price volatility from spot market purchases. These contracts (signed throughout 2025-2026) lock in prices for 10-15 year periods, insulating Vietnam from the kind of price shocks that spiked costs in Q1 2026.
Oil/gas will remain 18-20% of Vietnam’s generation mix through 2030, but increasingly used for peaking power (high-cost, used only when demand spikes) rather than baseload. Manufacturing impact: factories should assume natural gas prices will remain higher than coal/renewables, but more stable through long-term contracts.
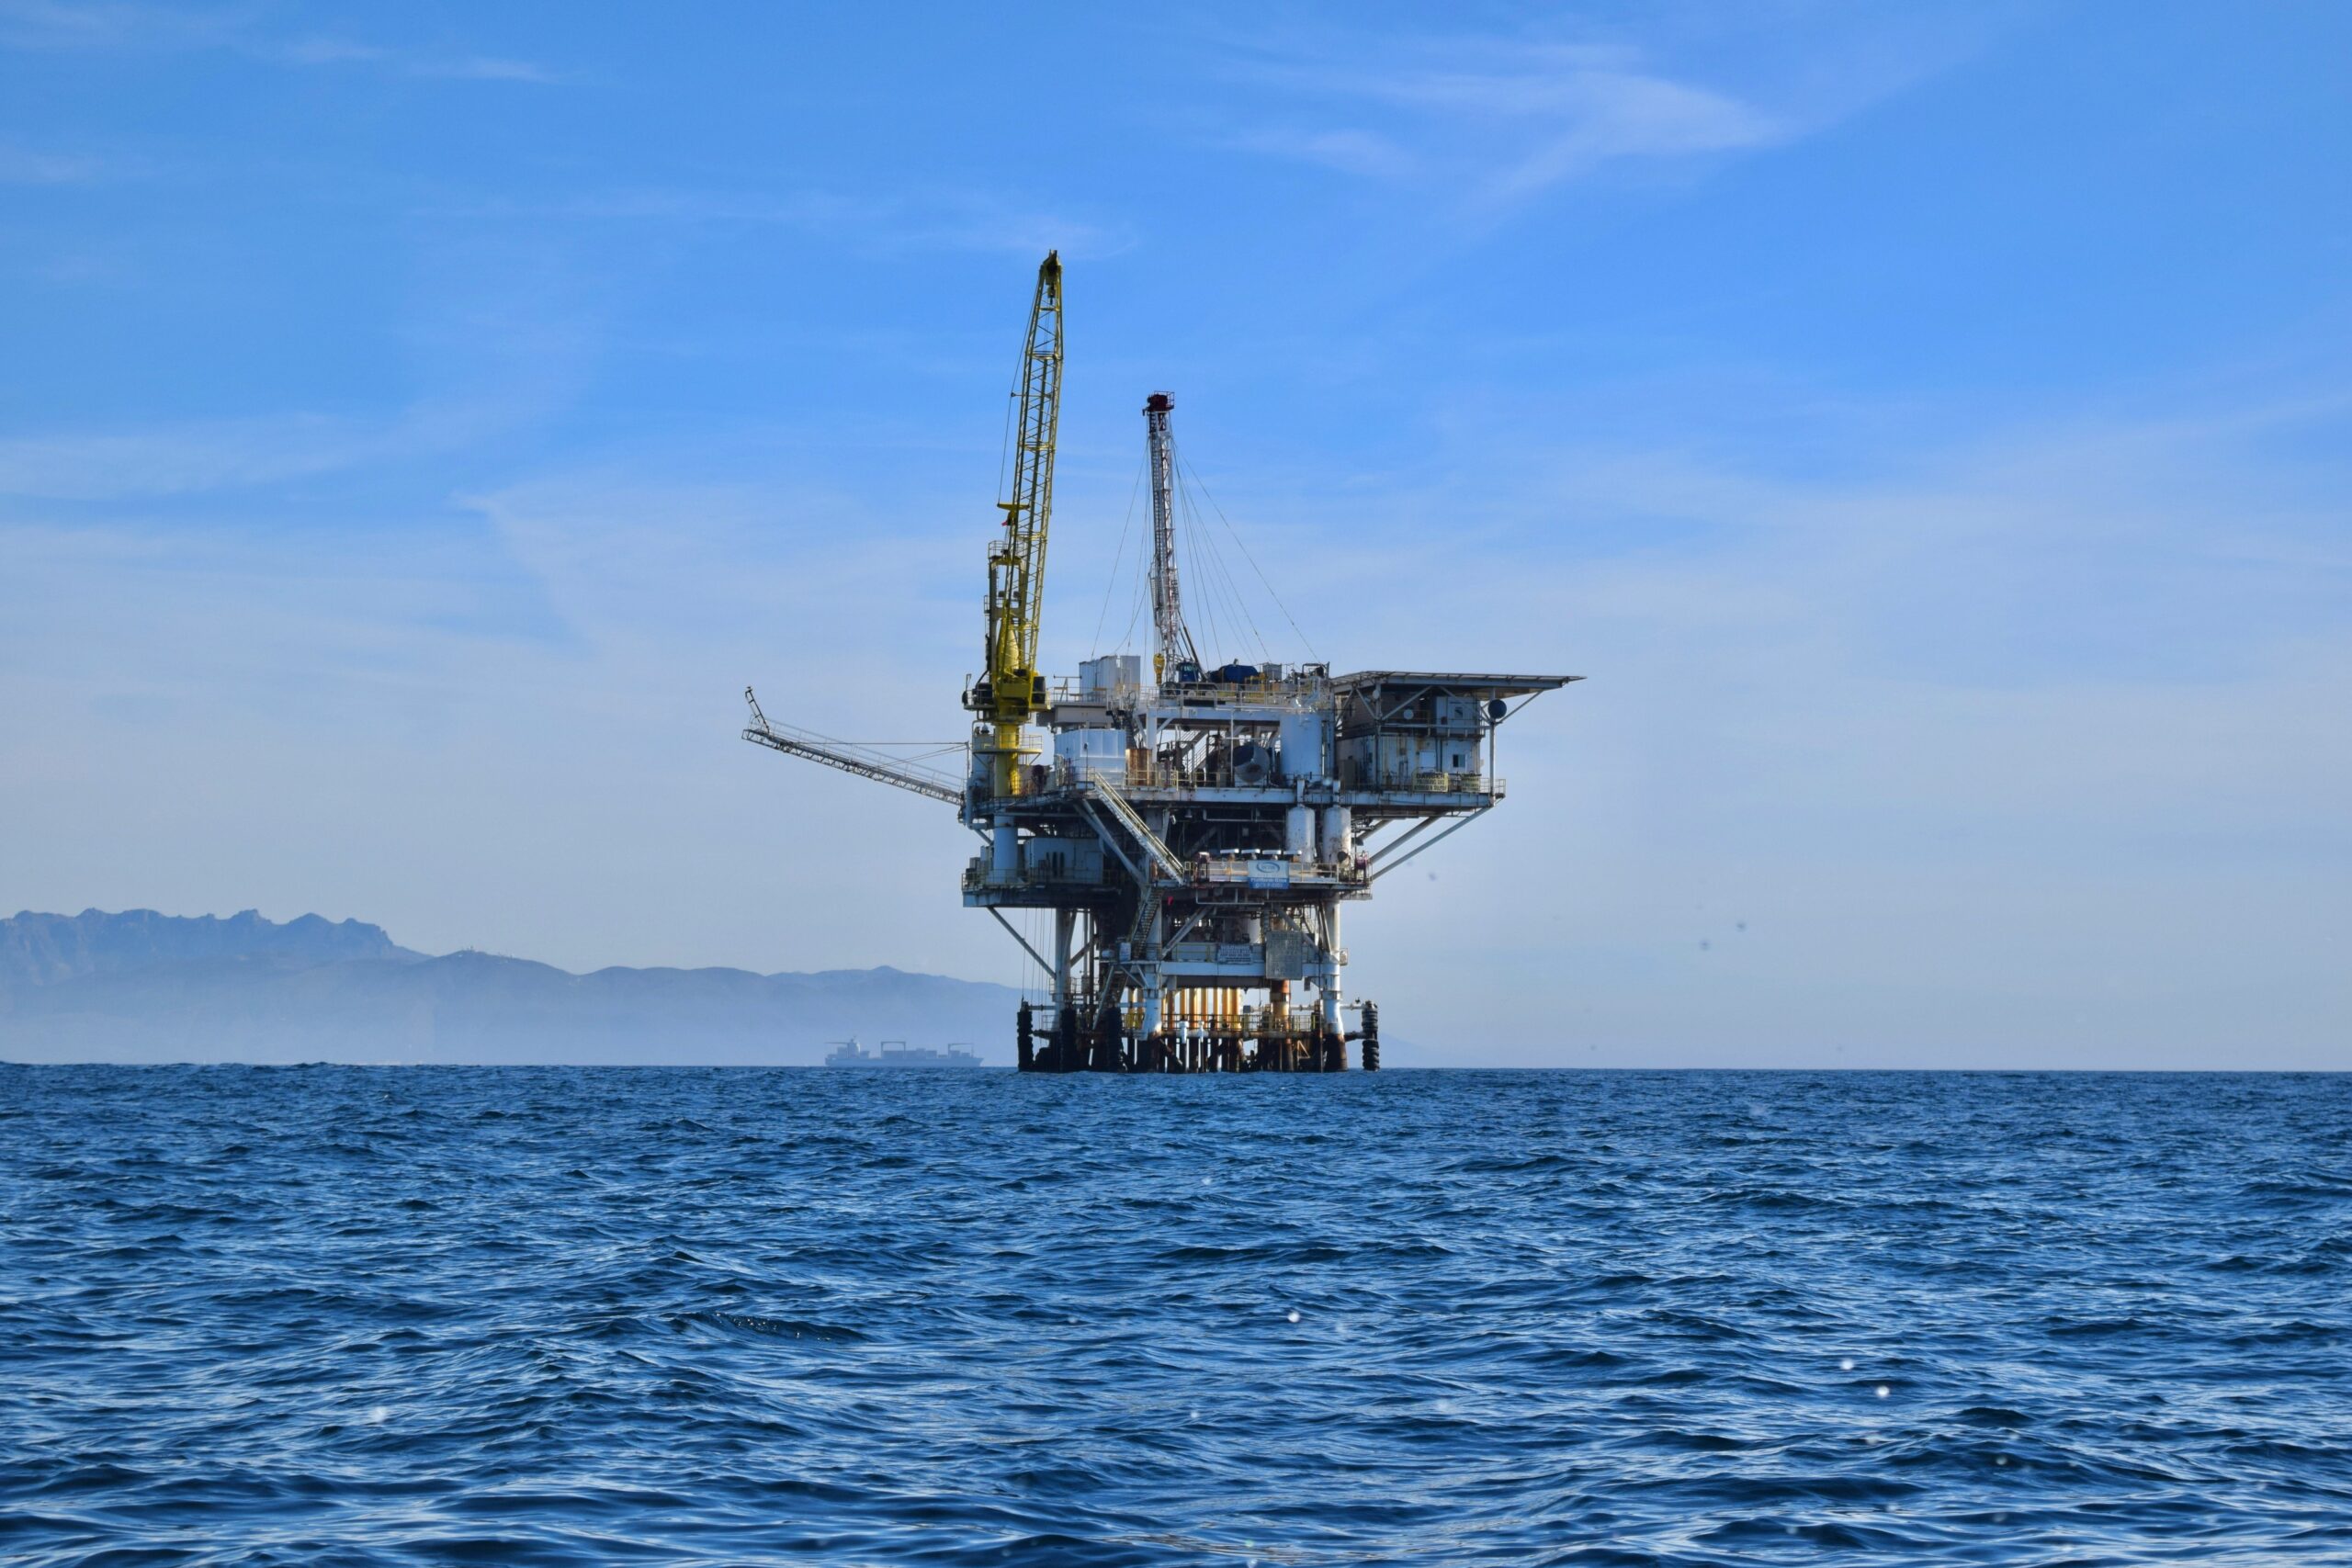
Figure 5: Vietnam’s domestic oil production covers only 10% of demand; long-term import contracts with Qatar, UAE, and Angola reduce future volatility.
The Energy Mix Transformation: Timeline to Cost Stability
2025 Baseline: Coal 38% | Hydro 28% | Oil/Gas 21% | Solar 2% | Wind 1%
2026 Target: Coal 35% | Hydro 25% | Oil/Gas 18% | Solar 8% | Wind 3%
2030 Forecast: Coal 26% | Hydro 20% | Oil/Gas 16% | Solar 18% | Wind 14%
By 2030, renewables (solar + wind) will provide 32% of Vietnam’s electricity, up from current 3%. This doesn’t eliminate vulnerability to oil price shocks, but it dramatically reduces grid dependence on expensive fossil fuels. Manufacturing costs stabilize accordingly.
Vietnam vs. Regional Competitors: The Energy Resilience Advantage
China (Energy Vulnerability: 8/10): Coal remains 52% of China’s energy mix. Coal reserves adequate but quality declining; most accessible reserves depleted. Oil imports reach 11 million bpd (China imports 70% of oil). Renewable capacity is expanding fast (650 GW solar, 380 GW wind) but grid integration challenges cause 15-20% curtailment rates (generated power that can’t be used). China’s energy costs remain elevated through 2026-2027 as old coal plants are retired faster than renewables can compensate. Manufacturing advantage: Vietnam.
India (Energy Vulnerability: 9/10): Coal provides 70% of electricity; reserves substantial but require heavy investment in extraction infrastructure. Oil imports at 4.2 million bpd; prices spike disproportionately during global disruptions (limited strategic reserves). Renewable capacity (180 GW solar, 60 GW wind) growing but hampered by grid integration bottlenecks and seasonal monsoon impacts on solar/wind output. Power outages remain common during peak demand (April-May, before monsoon). Manufacturing costs volatile through 2027. Manufacturing advantage: Vietnam.
Indonesia (Energy Vulnerability: 7/10): Coal represents 60% of generation; Indonesia has world’s largest coal reserves (152 billion tons) but domestic consumption + exports compete for supply. Oil imports at 650,000 bpd (smaller than China/India but meaningful). Renewable capacity minimal (20 GW solar, 3 GW wind). Geographic constraints (archipelago) complicate grid distribution and raise transmission costs. Renewable deployment slower than Vietnam due to infrastructure/financing challenges. Manufacturing advantage: Vietnam.
Thailand (Energy Vulnerability: 6/10): Diversified mix: coal 20%, natural gas 40%, hydroelectric 14%, renewables 8%. Imports significant quantities of natural gas (from Myanmar, Laos) creating supply chain risk. Renewable expansion slower than Vietnam but progressing (current 8 GW, planned additions 5-8 GW). Grid stability generally good but seasonal drought impacts hydroelectric capacity. Manufacturing advantage: Slight edge to Vietnam due to faster renewable deployment + lower oil import dependence.
Vietnam (Energy Vulnerability: 5/10): The transformation strategy is working. Renewable capacity expanding fastest among Asian manufacturers (adding 12-15 GW annually through 2030). Hydroelectric baseload stable. Oil import dependence (90%) is high, but long-term contracts reduce price volatility. Coal reserves abundant but declining in generation mix. By end of 2026, energy resilience will materially exceed competitors in the region.
Summary: Vietnam’s deliberate energy diversification strategy—combined with capital investment—creates structural cost advantage over regional competitors through 2027-2028. This advantage directly translates to lower manufacturing costs for importers sourcing from Vietnam.
Manufacturing Impact: Timeline to Cost Normalization
Q2-Q3 2026 (Current Phase): Energy costs remain elevated 12-18% above 2024 baseline. This is the peak-cost window. Factories are willing to negotiate discounts on long-term contracts to secure volume certainty. Importers locking in contracts now benefit from desperation pricing.
Q4 2026 (Transition): First wave of solar capacity (4-5 GW) and offshore wind (1-2 GW) comes online. Grid electricity costs begin declining 5-8% from Q2-Q3 peaks. Factory electricity bills improve. Pricing pressure eases as power becomes more available.
2027-2028 (Normalization): Cumulative renewable capacity (22-26 GW solar + 8-10 GW wind) stabilizes grid. Electricity costs return to 2024 levels or below. Manufacturing costs normalize. Factories that invested in rooftop solar now benefit from 20-30% electricity cost savings vs. grid-dependent competitors.
Sourcing Strategy: Lock in long-term contracts (12-24 months) now at peak-cost pricing. Benefit when renewable capacity drives costs down by 15-20% in late 2026/early 2027. Competitors who wait will find factories at full capacity and unwilling to discount.
Bottom Line: Energy Resilience = Manufacturing Competitive Advantage
Vietnam’s energy crisis catalyzed the country’s most ambitious infrastructure transformation in a generation. By deliberately investing $136.3 billion in renewables and grid modernization, the government is solving a short-term problem (Q1 2026 energy shock) while creating a long-term competitive advantage (2027+ cost leadership).
No other major Asian manufacturing destination is executing energy transformation at Vietnam’s pace. China’s renewable expansion is faster in absolute terms but hampered by grid integration and coal phase-out challenges. India’s renewable capacity is growing but hampered by coal dependence and grid constraints. Indonesia’s deployment is too slow to matter through 2027.
For importers, this means: Source from Vietnam now (lock in contracts at peak-cost pricing), benefit from Q4 2026 renewable capacity additions (15-20% cost reductions), and enjoy sustained competitive advantage through 2027-2028 as Vietnam’s energy costs permanently normalize below regional alternatives.
That’s not just sourcing. That’s future-proofing your supply chain against energy shocks the entire region will still be experiencing.
Questions about sourcing strategy through Vietnam’s energy transition? Vietnam Direct Sourcing tracks energy grid changes, factory-level power costs, and renewable investment across Central Vietnam manufacturing clusters. We help importers time sourcing contracts to benefit from renewable capacity additions and cost normalization. Our local team understands which factories are investing in solar self-generation (and thus have locked-in low future energy costs) and which are grid-dependent (and thus face cost risk through Q4 2026).
Connect with us to optimize your sourcing strategy for Vietnam’s energy transition.
Tags: vietnam energy resilience | manufacturing costs vietnam | renewable energy vietnam | solar wind hydroelectric coal | energy crisis manufacturing | asia manufacturing energy comparison | da nang sourcing energy stability
Learn more about this topic on our podcast!
Want to dive deeper into this subject? Check out our latest podcast on this subject on Spotify, where we explore this topic and so much more! Whether you're on the go or relaxing at home, tune in for insights, tips, and discussions that bring our blog topics to life.
Leave a comment
Your email address will not be published. Required fields are marked *